There’s a lot of talk happening about Google’s Page Experience update, due out in May 2021. The most anticipated (and perhaps anxiety-producing) part of the update is Google announcing that sites with passing Core Web Vitals will receive a ranking boost on mobile.
In this article, we’ll outline
- What Core Web Vitals are,
- Why they’re important, and
- What you need to do to ensure your WordPress site is ready.
Core Web Vitals: An Overview
Call ‘em crazy or not, but Google wants to reward site owners who give the best overall experience to users by boosting their rankings. In addition to great content, that means scoring well on ‘page experience’ signals.
The idea of optimizing site speed and performance to get better rankings is nothing new.
We know that sites should be mobile-friendly, and in 2015 Google began actively penalizing sites that weren’t responsive. We also know that securing our sites via HTTPS is important. In 2018, Google incentivized us to adopt HTTPS by marking non-encrypted sites with “not secure” in search results.
Mobile-friendliness and secure browsing are just a couple of the page experience signals Google uses to determine site ranking. Core Web Vitals (CWV) comes into play by adding three additional page experience signals:
- Largest Contentful Paint (LCP) – The amount of time it takes to render the largest element on your page (i.e. image, video, or block of text), regardless of where it’s placed on the page (i.e. header, footer, or content area). The ideal LCP measurement is 2.5 seconds or faster.
- First Input Delay (FID) – The time it takes from when a user first interacts with a page (i.e. click a link) to when the browser responds to that interaction. The ideal FID measurement is less than 100 ms.
- Cumulative Layout Shift (CLS) – The amount of unexpected layout shift of visual page content. The ideal CLS measurement is less than 0.1.
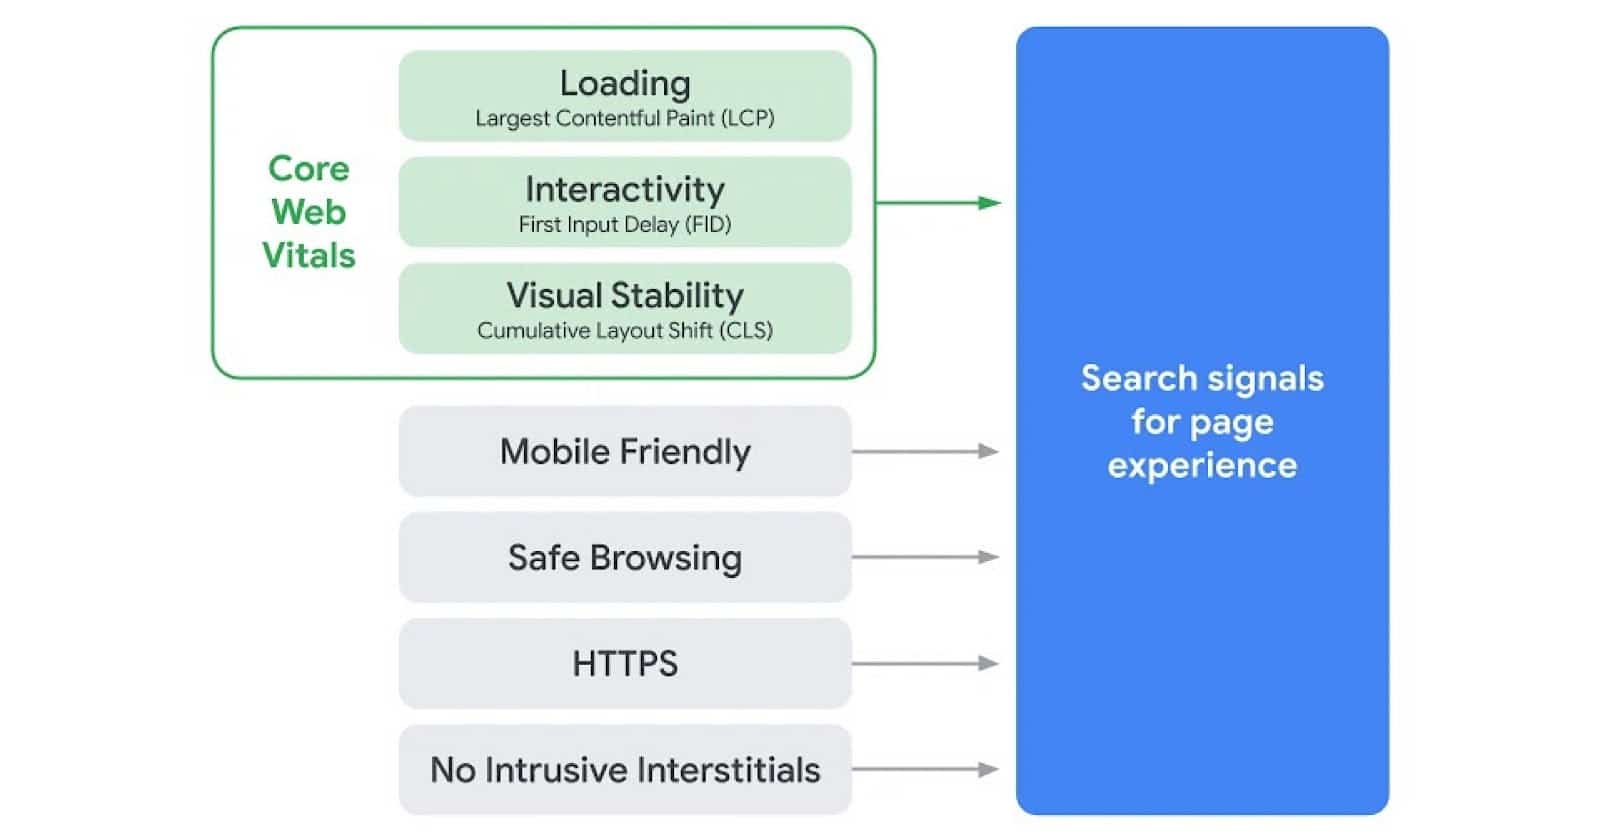
The updated page experience signals combine Core Web Vitals with Google’s existing search signals (mobile-friendliness, safe-browsing, HTTPS-security, and intrusive interstitial guidelines). Collectively these help determine the overall performance of a website.
What this means for you
As we’ve already seen with Google’s existing search signals, Google rewards (or penalizes) a site’s rankings based on compliance. While it’s important to check your site for CWV, there’s no need to freak out if your score is lacking.
At the end of the day, content is still king and all the sites you compete with for rankings are going through the same thing you are! Think of CWV like this: if you take two pages with equally amazing, optimized content, CWV would likely be the “tie-breaker” that boosted one page over another.
So, while there’s no cause for panic, let’s talk about what you can do to make sure your WordPress site(s), including those running on the Genesis Framework, are ready for the change.
Get your baseline measurements
First things first, you need to know where your site (and its pages) currently stand. Google gives us six tools site owners can measure Core Web Vitals, including:
- PageSpeed Insights
- Search Console
- Lighthouse
- Chrome UX Report
- Chrome DevTools
- Chrome Web Vitals Extension
Depending on your current workflow with Google development tools, you may prefer one method over another. Below we’ll discuss three of the ways you can measure CWV.
As with any performance testing and subsequent site tweaking, keep in mind you’ll want to spend your time tackling the issues that will give you the most bang for your buck. Later in this article, we’ll talk about specific ways you can address the most common problems.
Google PageSpeed Insights
When it comes to performance testing, it’s important to consider the environment of the test. For example, results in a controlled lab environment may differ from “real world” usage data collected on a variety of devices or network conditions.
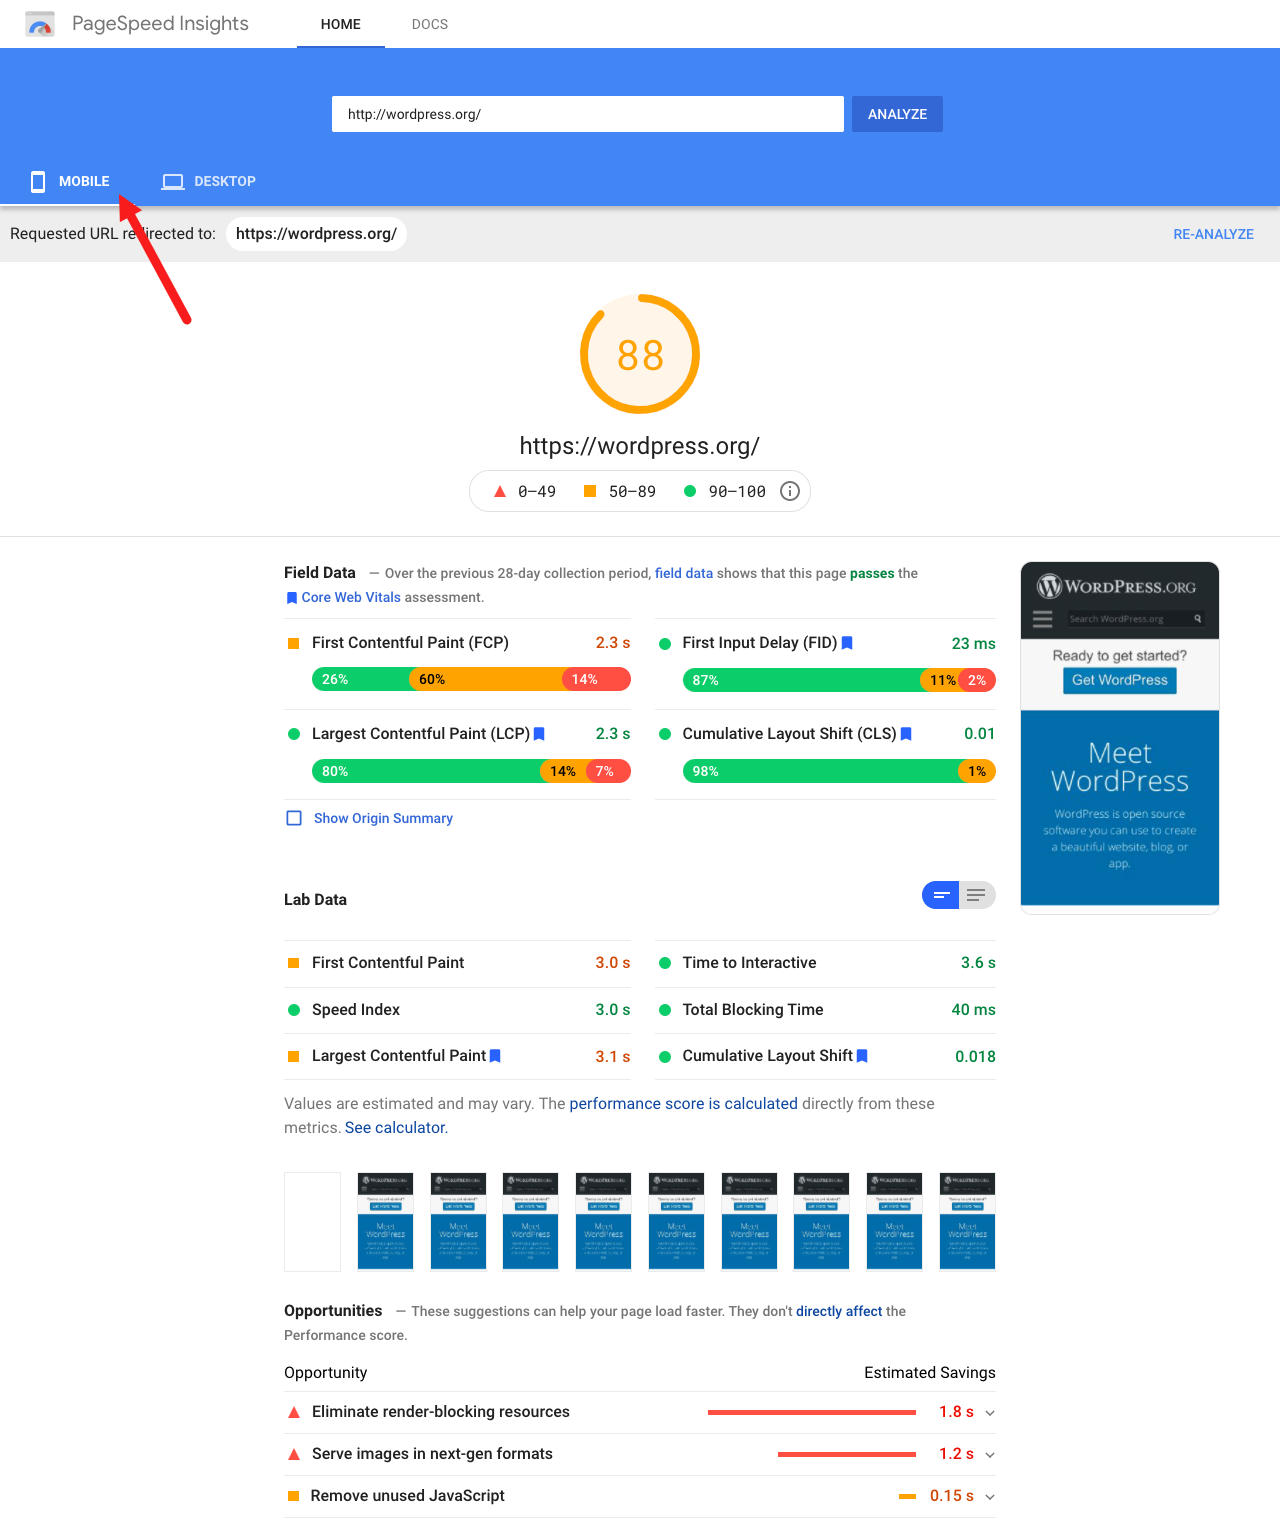
Google’s PageSpeed Insights is a great way to deep dive on a single URL, getting a load of information on Core Web Vitals (both Field Data and Lab Data) as well as suggestions to improve page load time.
It further lets you distinguish between mobile results and desktop results. The only down-side to PageSpeed Insights is that you can only test one URL at a time.
Google Search Console
The most comprehensive report can be found by using Google Search Console, which pulls data from the Chrome User Experience Report. This reflects actual usage data on your site from users around the world. Unlike PageSpeed Insights, the CWV report included here shows results for an entire site, not just a single URL.
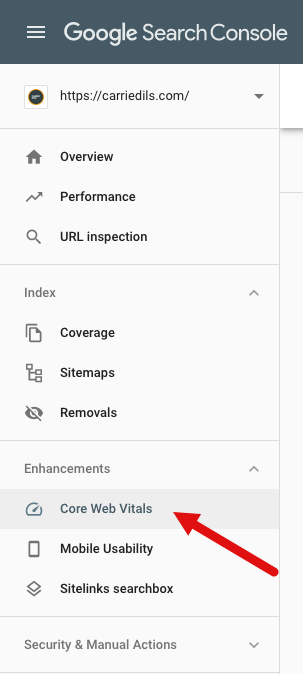
This is helpful because you may be able to identify a single issue affecting multiple URLs on your site. Fixing that issue once could resolve it across all affected pages.
Like PageSpeed Insights, Google Search Console will show you reports for both mobile and desktop. Note that if you have a site that doesn’t receive much mobile traffic, there may not be sufficient field usage data to report on.
Web Vitals (Chrome Extension)
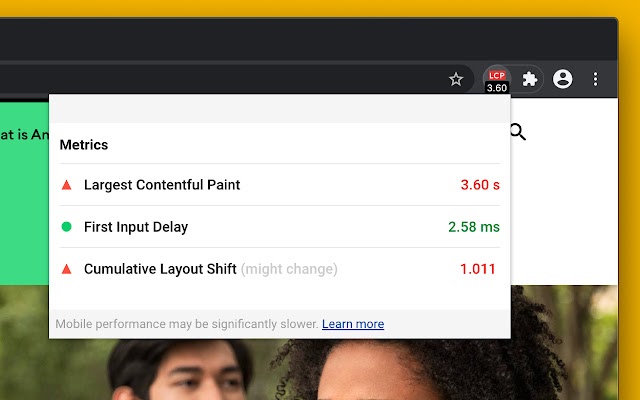
To quickly see CWV metrics for any web page, you can install the Web Vitals extension for Chrome. While this isn’t going to be a deep dive, it’s a great way to get a feel for pages on your site or even check in on how your competitors are doing.
Improving your Core Web Vitals Score
In this section, we’ll address common issues you might encounter when using WordPress and/or the Genesis Framework.
First, you need to run tests to get your baseline results. You can use any of the assessment tools Google provides. Consider starting with Google Search Console as it’s a great place to get overall results for a site.
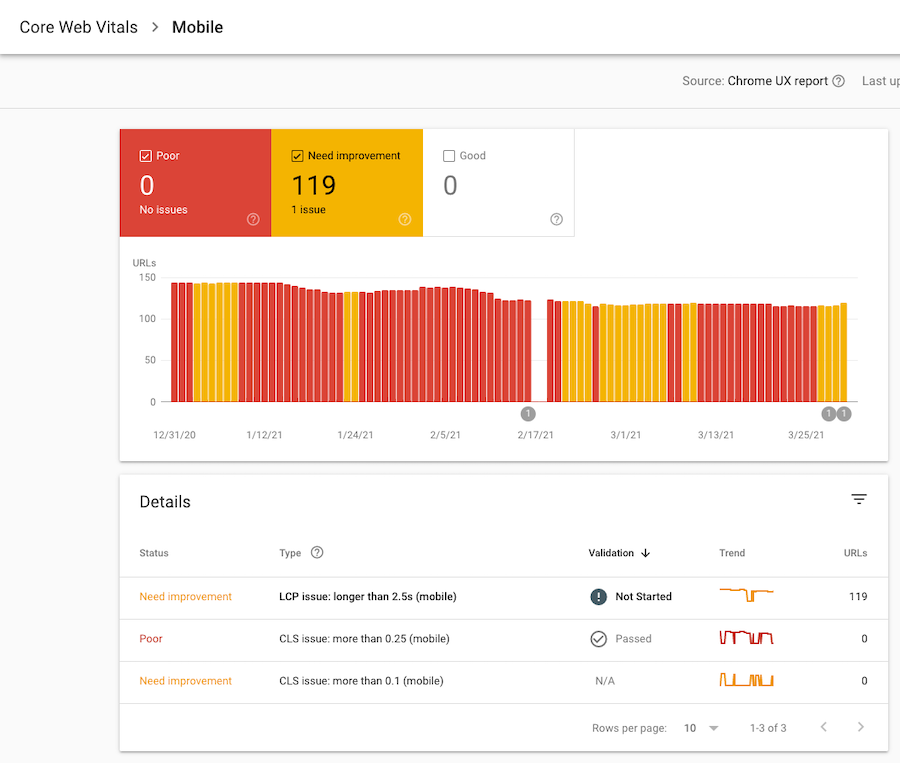
From there, you can click on any issues to see affected URLs. At that point, you can take one of those URLs and run in through PageSpeed Insights to learn specifically which issues are causing poor CWV scores.
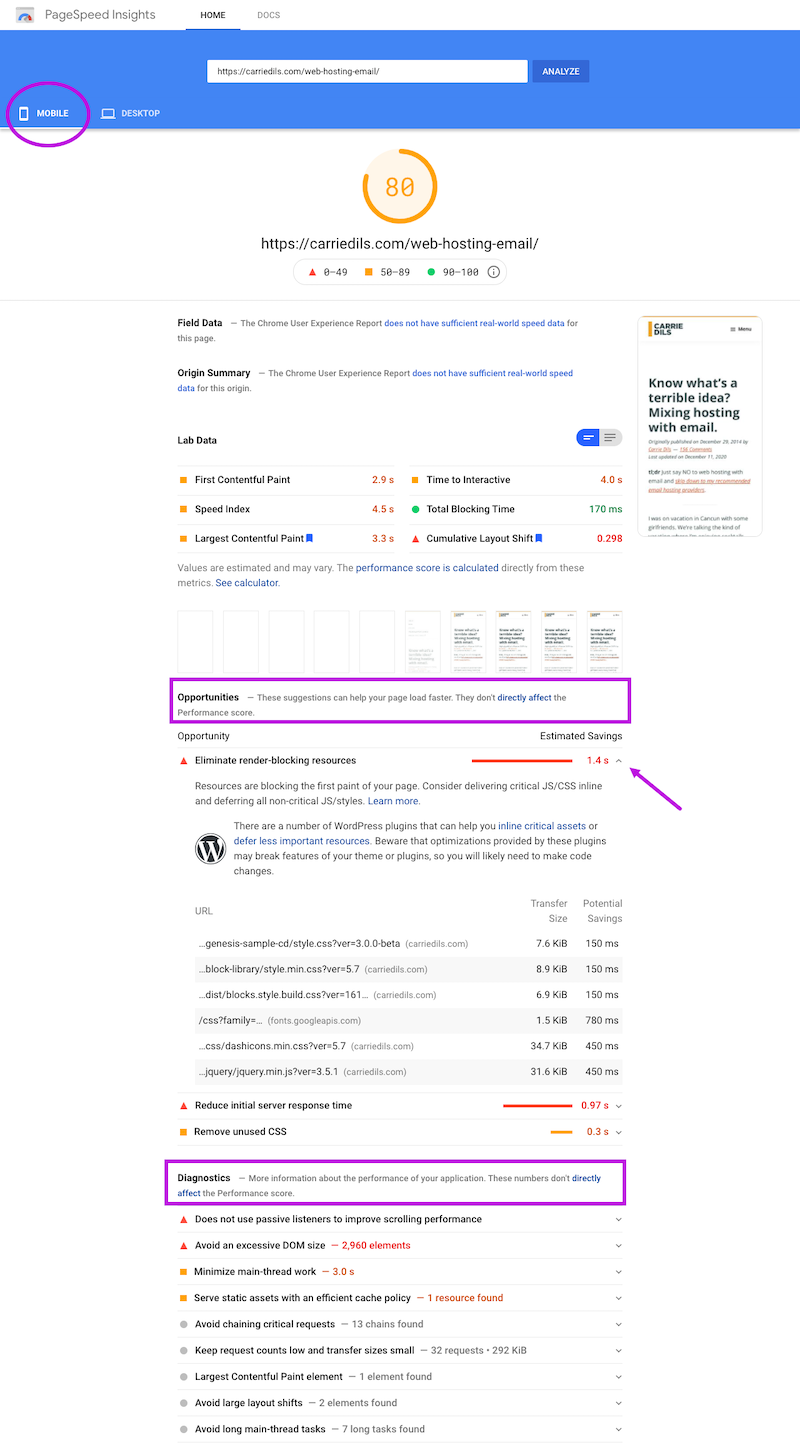
After testing the URL in PageSpeed Insights, make sure you’re viewing results for Mobile. From there, drill down into Opportunities and Diagnostics to get specific data about issues affecting performance.
Now read on to find out how you can address those issues.
Pro tips for testing:
- If testing locally with Lighthouse, DO log out of your WordPress install (the admin bar on a logged-in site adds extra “weight”)
- Remember that a local speed test will likely be faster than a lab test (or field test data), so while you can definitely use it to identify areas for improvement, don’t forgo testing “in the wild” with PageSpeed Insights or Google Search Console.
- Run a test multiple times. Google reports are notoriously inconsistent.
- Try not to get too far in the weeds. You’ll get the maximum benefit from fixing site-wide issues.
- Focus on mobile search results, not desktop, when optimizing for Google SEO.
Improving Largest Contentful Paint (LCP)
We mentioned earlier that “Largest Contentful Paint”, or LCP is the amount of time it takes to render the largest element on your Page. This metric is meant to penalize sites with heavy elements.
In the latest Genesis Shapers Recap, we discussed the upcoming changes to Google, and David Vogelpohlmade an interesting point about this:
This really gets back to the root of performance optimization and site optimization in general. I think about it as the balance between suffering and joy… the joy of adding new experiences to your site, but the suffering that it introduces in terms of page size, wait times, and visitor experience. But the [larger elements] you add are for visitor experience!
My observation is that that web page might be doing the exact job it’s supposed to do for the people who were there to enjoy it. And that minimalist page design might not even be the right choice for the visitor and context.
The keyword there is balance. Yes, shoot for better metrics, but not at the expense of the experience you’re trying to create for your visitors.
Stepping down from my soapbox, let’s talk about the most common causes of poor LCP:
- Slow server response times
- Render-blocking JavaScript and CSS
- Slow resource load times
- Client-side rendering
You can go research those individual elements on their own using the links provided, but let’s get straight to the point: How do you improve those offenders of LCP? In short:
- Use a quality web host
- Implement lazy loading
- Minify scripts & styles
- Compress images
Aside from the quality web host, many plugins address these issues separately, (i.e. Smush for compressing and lazy loading images or Autoptimize for minifying and lazy loading scripts and styles, etc.).
You’ll also find some all-in-one plugins, such as WP Rocket, that offer a full suite of performance optimization tools, including caching.
Caution:
If you opt to use a combination of plugins to address performance issues, just make sure you’re not overlapping efforts (i.e. have two different plugins minifying scripts) as that could result in some unexpected behavior.
Improving First Input Delay (FID)
FID is the delay between when a user clicks or taps on something (i.e. a link or a button), and the time it takes for the browser to respond to that action. Time to Interactive (TTI) is a similar metric, but unlike FID which measures the first interaction, TTI measures the time it takes for a page to be fully interactive.
The most common cause of slow FID is JavaScript. According to web.dev, a Google Developer resource site, here’s how you can improve FID:
- Reduce the impact of third-party code
- Reduce JavaScript execution time
- Minimize main thread work
- Keep request counts low and transfer sizes small
Addressing some of the issues that cause slow LCP will likely improve your FID as well, in particular image compression and script/style minification.
The other biggie to point out is third-party scripts running on your site.
For example’s sake, let’s say you’re using MailChimp for email marketing. Does a MailChimp plugin need to load scripts and styles on every single page of your site? Most likely, it only needs to run code on pages that include a signup form.
Use Chrome or Firefox web developer tools to identify everything that’s loading on a web page.
You may find some unnecessary code (or code that’s not important for your site).
For example, you’ll commonly find scripts loading to support Dashicons and Emojis. Do you want or need them? If not, get rid of them.
Look for ways to remove unused/unnecessary code.
Improving Cumulative Layout Shift (CLS)
CLS measures the total of all unexpected layout shifts on a page. A layout shift happens when a visible element changes position from one rendered frame to the next. If you’ve encountered it in the wild, you know it’s a frustrating user experience!
So what causes it?
Unexpected movement of page content usually happens because resources are loaded asynchronously or DOM elements get dynamically added to the page above existing content. The culprit might be an image or video with unknown dimensions, a font that renders larger or smaller than its fallback, or a third-party ad or widget that dynamically resizes itself. – https://web.dev/cls/
When asked about CLS in the latest Genesis Shapers meeting, developer Bill Erickson said this:
We’ve found the biggest cause of CLS shifts in our themes has been the use of Google fonts. Because of the font-swap setting, it loads a fallback font until the custom font has [finished] loading, which can lead to large layout shifts if the fonts render differently.
After stating a preference for using system fonts, Bill goes on to say that this tool is helpful for styling a fallback font to more closely match a custom font, preventing big layout shifts.
Genesis Shaper Mike Hemberger added that if you are going to use a custom font (i.e. Google Fonts), self-host those fonts rather than pulling from Google CDN.
So font loading can contribute to poor CLS. What are some other opportunities to reduce CLS?
- Include size attributes on images, videos, and iframes. That “holds the space” required for an element while it’s in the process of loading.
- Reserve space for ads. This is basically the same as the last bullet point but deserves a special mention as ad injections can be a major contributor to CLS.
- Take care with dynamically-injected content, such as email opt-ins and GDPR/cookie notices, etc. If you need this kind of content, dynamically inject it below the fold.
While these are common opportunities, you’ll want to use PageSpeed Insights (or another Google assessment tool) to identify specific areas for improvement on your site.
Do Optimize. Don’t Freak Out.
At this point, you’re armed with some ways you can start analyzing and improving your site’s Core Web Vitals.
Should you be worried about Google’s rollout of CWV? We think it’s worth repeating: Content is still king.
Yes, you should absolutely aim to improve your visitor’s experience and Core Web Vitals are how Google intends to measure that. But don’t throw all of your eggs in the site performance basket at the expense of creating valuable, SEO-optimized content.
Anita Carter, owner of the Cre8tive Diva handles a lot of theme support requests and is very active in the Genesis community. When we asked for her advice about the pending Google changes, she said,
“it’s nothing to panic over.”
Sage words, Anita.
Stay calm, optimize on.
